You are using an out of date browser. It may not display this or other websites correctly.
You should upgrade or use an alternative browser.
You should upgrade or use an alternative browser.
Why Conspiracy Theories?
- Thread starter sherief
- Start date
-
- Tags
- apples are not racist baggy bumhole due to heroin black eyed babies conspiragasms conspiranauts control craner's defence league haugen 2024 homedawg1 king of the goblin nonces lizards moon unit mr tea is a cop nanoo nanoo nazis all over the shop nazis in exeter nazis nazis nazis nebuchadnezzar patty is an old whig pogrom massive san francisco is a suburb of ipswich steve jobs is living in egypt the day yyaldrin went vegan tin foil hats where is ghislaine’s other foot? zoom in
william_kent
Well-known member
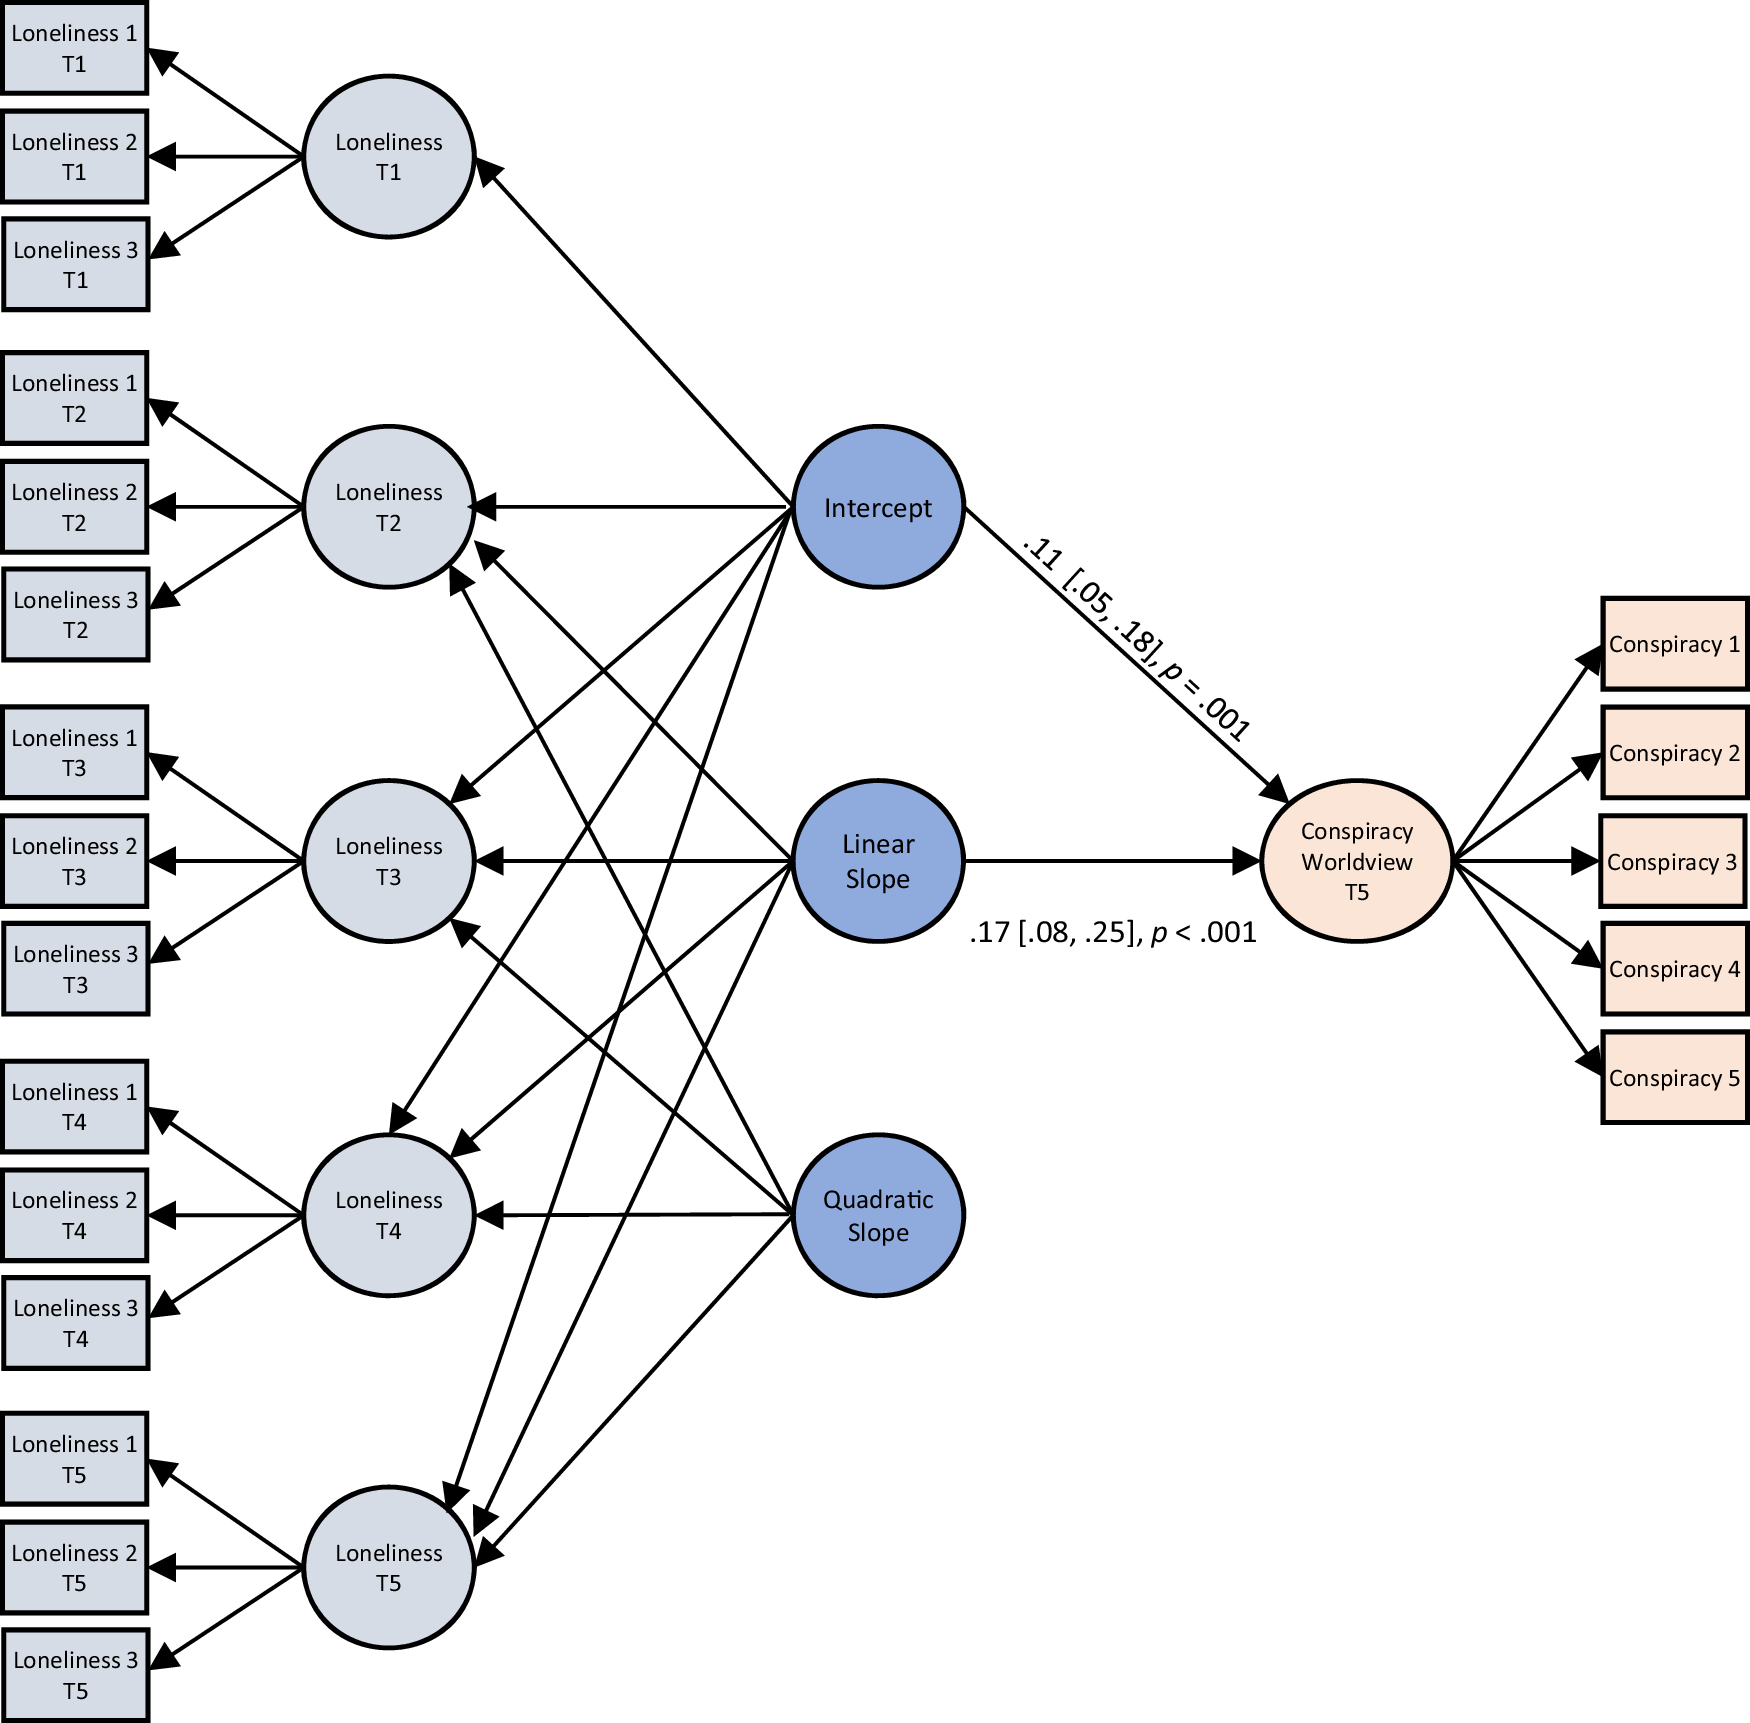
Second order quadratic latent growth curve model showing that the initial level (intercept) of loneliness, as well as the trajectory (linear slope) of loneliness over five waves are associated with higher endorsement of a conspiracy worldview in midlife.

Loneliness trajectories over three decades are associated with conspiracist worldviews in midlife

Standardized path coefficients, 95% confidence intervals and exact p-values are presented. Loneliness 1–3 and Conspiracy 1–5 denote the observed indicators (items) used to measure, respectively, loneliness and conspiracy worldview. T1–T5 denote five timepoints at which loneliness was measured. Measurement models of loneliness are displayed in light blue, second order latent constructs of the growth model of loneliness are displayed in dark blue, and the measurement model of conspiracy beliefs in pink. All correlations between the intercept and slopes, as well as correlations of residuals of equivalent items measuring loneliness at different timepoints, were also estimated but are not visualized for model readability. All p-values are two-tailed and based on the z statistic. Since the analysis is a latent growth curve model with one outcome, adjustments for multiple comparisons are not applicable. See Table 1 for detailed model estimates.
Loneliness trajectories over three decades are associated with conspiracist worldviews in midlife
mixed_biscuits
_________________________
Distance brings objectivitySecond order quadratic latent growth curve model showing that the initial level (intercept) of loneliness, as well as the trajectory (linear slope) of loneliness over five waves are associated with higher endorsement of a conspiracy worldview in midlife.

Loneliness trajectories over three decades are associated with conspiracist worldviews in midlife
Mr. Tea
Let's Talk About Ceps
mixed_biscuits
_________________________
You'll never be alone with that Biscuits co-dependency thing you've got. You made a grand show of putting me on ignore and it's lasted all of 2 days.
mixed_biscuits
_________________________
Is that Neil Lenin?
Mr. Tea
Let's Talk About Ceps
"80-year-old has baggy skin and is therefore an actor in a rubber mask" ranks up there with the conspiracy theory I saw someone plugging (with apparently total earnestness) on Facebook once, that the man we call 'Vladimir Putin' today is in fact an actor who at some point replaced the real Putin. The evidence for this is plain for all to see, in that Putin looks a bit different from how he looked 20-odd years ago.
Mr. Tea
Let's Talk About Ceps
It's probably Them trying to stop you dropping your conspiracy-busting truth-bombs on our sleepy heads!!!Might be a technical issue now that its being run by a maniac


